
Step-by-Step Guide: Creating Accurate Tally Charts with Microsoft Excel
Step-by-Step Guide: Creating Accurate Tally Charts with Microsoft Excel
Quick Links
- Create the Tally system
- Total the Groups of Five
- Total the Leftover Singles
- Make the Tally Graph with a Formula
- Hide the Helper Columns
A tally graph is a table of tally marks to present the frequency in which something occurred. Microsoft Excel has a large number of built-in chart types available, but it does not have a tally graph option. Fortunately, this can be created using Excel formulas.
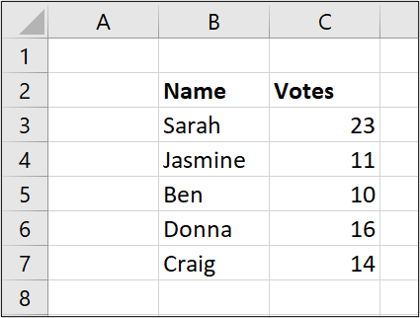
For this example, we want to create a tally graph to visualize the votes received by each person on a list.
Create the Tally system
A tally graph is normally presented as four lines followed by a diagonal strikethrough line for the fifth tally. This provides a nice visual grouping.
It is difficult to replicate this in Excel, so instead, we will group the values by using four pipe symbols and then a hyphen. The pipe symbol is the vertical line above the backslash character on the U.S. or U.K. keyboard.
So, each group of five will be shown as:
||||-
And then a single pipe symbol for a single occurrence (1) will appear as:
|
Type these symbols into cells D1 and E1 on the spreadsheet.
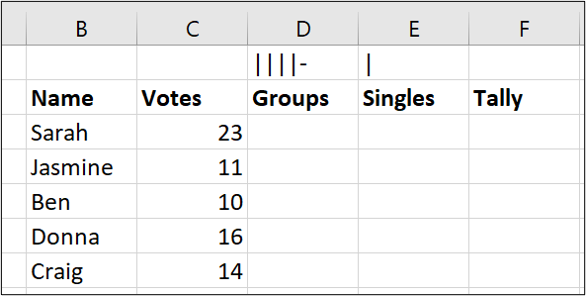
We will create the tally graph using formulas and reference these two cells to display the correct tally marks.
Total the Groups of Five
To total the groups of five, we will round the votes value down to the nearest multiple of five and then divide the result by five. We can use the function named FLOOR.MATH to round the value.
In cell D3, enter the following formula:
=FLOOR.MATH(C3,5)/5
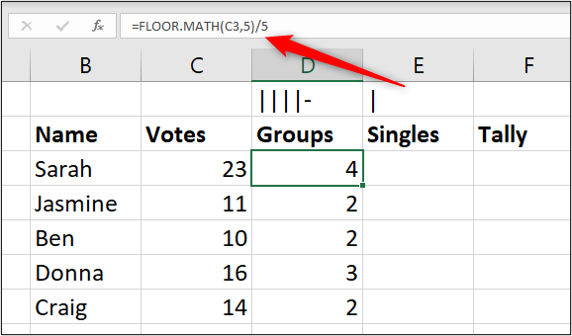
This rounds the value in C3 (23) down to the nearest multiple of 5 (20) and then divides that result by 5, giving the answer 4.
Total the Leftover Singles
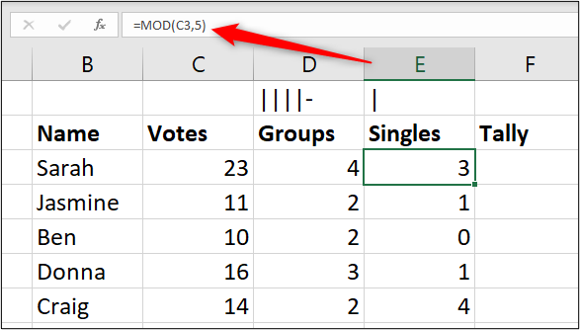
We now need to calculate what is left over after the groups of five. For this, we can use the MOD function. This function returns the remainder after two numbers are divided.
In cell E3, enter the following formula:
=MOD(C3,5)
Make the Tally Graph with a Formula
We now know the number of groups of five and also the number of singles to display in the tally graph. We just need to combine them into one row of tally marks.
To do this, we will use the REPT function to repeat the occurrences of each character the required number of times, and concatenate them.
In cell F3, enter the following formula:
=REPT($D$1,D3)&REPT($E$1,E3)
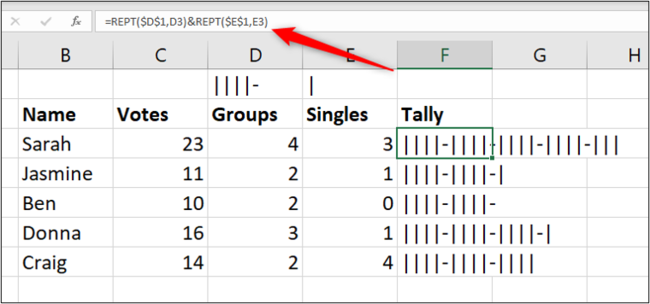
The REPT function repeats text a specified number of times. We used the function to repeat the tally characters the number of times specified by the groups and singles formulas. We also used the ampersand (&) to concatenate them together.
Hide the Helper Columns
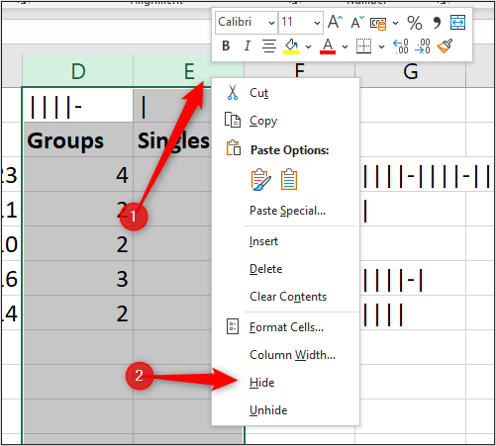
To finish the tally graph, we will hide the helper columns D and E.
Select columns D and E, right-click, and then choose “Hide.”
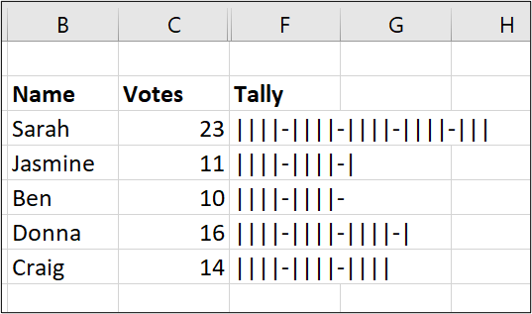
Our completed tally graph provides a nice visual presentation of the number of votes each person received.
Also read:
- [Solution Guide] Defeat Dev Error #6068: Mastering the Fix for Microsoft WOW64 Issue on Fortnite Battle Royale - 2024 Techniques
- [Updated] 2024 Approved Social Stream Top 8 Viral Videos
- [Updated] 2024 Approved Step-by-Step Guide IPhone Picture Perfection
- 2024 Approved Seamless Integration Facebook Livestream & Roku Connected TV
- 5 Métodos Efectivos Para Comprimir Un Archivo De Video MOV Y Minimizar Su Tamaño
- Clarifying the Turing Test Concepts and Future Contenders
- Comprehensive Teardown Troubleshooting: End Crash Issues Forever!
- Experience the Ultimate Bargain: Get Apple AirTags for $24 Less per Pack During Walmart’s Labor Day Sale, Featured by ZDNET!
- Expert Advice on Restarting and Repairing Intel Graphics Assistant Functionality
- Expert Tips on Accessing Technical Support for Your iPhone via Apple Support Tool
- Facebook's Prime Video Hits - The Best of Five
- Instant Fix for Your Sekiro Crashing Woes - A User-Friendly Guide
- New From Snapshots to Blockbusters The Ultimate Video Enhancement Tool
- No More Lags: Resolving FPS Drops, Eradicating Gameplay Hiccups & Boosting Performance.
- Painting with Light An Expert's Guide to Color Grading
- Resolved: Cod Trailer Gone Wrong - Fixing 'Modern Warfare 3' App Errors
- The Division 2: Enhancing Gameplay by Tackling LOW FPS and Smoothing Out Stutters
- Troubleshooting: Why FIFA 21 Won't Start Up
- Understanding WSAPPX: Solutions to Address Excessive Disk & CPU Consumption
- Title: Step-by-Step Guide: Creating Accurate Tally Charts with Microsoft Excel
- Author: Daniel
- Created at : 2024-12-04 17:49:48
- Updated at : 2024-12-06 17:12:12
- Link: https://win-answers.techidaily.com/step-by-step-guide-creating-accurate-tally-charts-with-microsoft-excel/
- License: This work is licensed under CC BY-NC-SA 4.0.