
Accurately Estimating Data Variability with Microsoft Excel: Techniques & Tips

Accurately Estimating Data Variability with Microsoft Excel: Techniques & Tips
Quick Links
- Arithmetic Mean of Values
- Standard Deviation of the Values
- Calculate the Standard Error
- Using Error Bars to Present Uncertainty in Charts
There is doubt surrounding the accuracy of most statistical data—even when following procedures and using efficient equipment to test. Excel lets you calculate uncertainty based on your sample’s standard deviation.
There are statistical formulas in Excel we can use to calculate uncertainty. And in this article, we will calculate the arithmetic mean, standard deviation and the standard error. We will also look at how we can plot this uncertainty on a chart in Excel.
We will use the following sample data with these formulas.
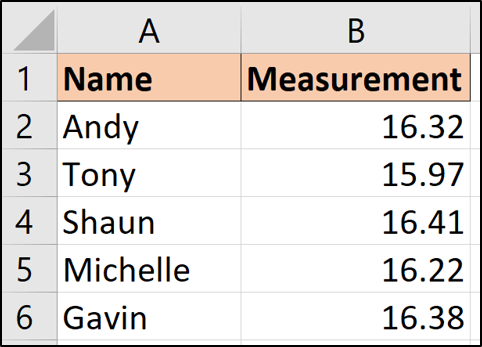
This data shows five people that have taken a measurement or reading of some kind. With five different readings, we have uncertainty over what the real value is.
Arithmetic Mean of Values
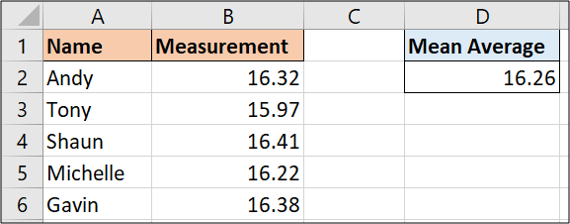
When you have uncertainty over a range of different values, taking the average (arithmetic mean) can serve as a reasonable estimate.
This is easy to do in Excel with the AVERAGE function.
We can use the following formula on the sample data above.
=AVERAGE(B2:B6)
Standard Deviation of the Values
The standard deviation functions show how widely spread your data is from a central point (the mean average value we calculated in the last section).
Excel has a few different standard deviation functions for various purposes. The two main ones are STDEV.P and STDEV.S.
Each of these will calculate the standard deviation. The difference between the two is that STDEV.P is based on you supplying it with the entire population of values. STDEV.S works on a smaller sample of that population of data.
In this example, we’re using all five of our values in the data set, so we will work with STDEV.P.
This function works in the same way as AVERAGE. You can use the formula below on this sample of data.
=STDEV.P(B2:B6)
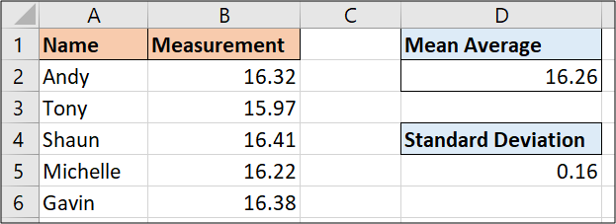
The result of these five different values is 0.16. This number tells us how different each measurement typically is from the average value.
Calculate the Standard Error
With the standard deviation calculated, we can now find the standard error.
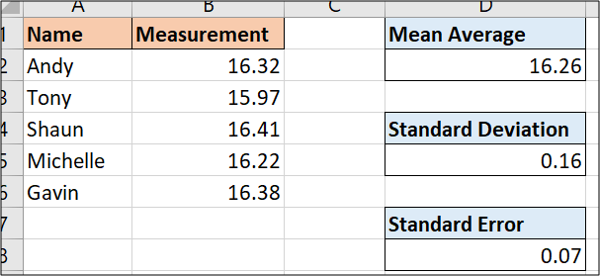
The standard error is the standard deviation divided by the square root of the number of measurements.
The formula below will calculate the standard error on our sample data.
=D5/SQRT(COUNT(B2:B6))
Using Error Bars to Present Uncertainty in Charts
Excel makes it wonderfully simple to plot the standard deviations or margins of uncertainty on charts. We can do this by adding error bars.
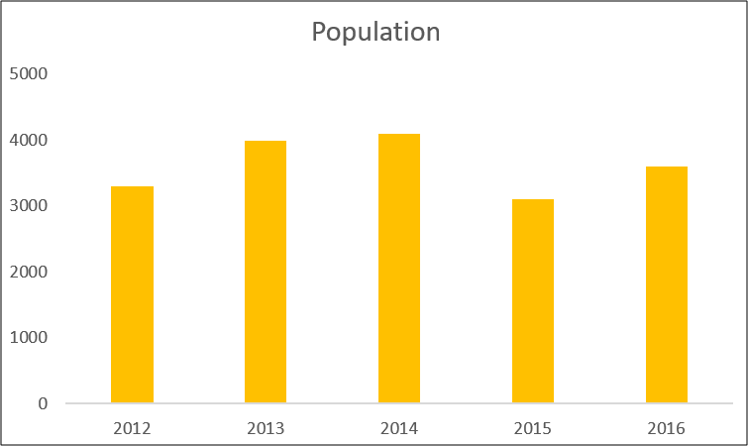
Below we have a column chart from a sample data set showing a population measured over five years.
With the chart selected, click Design > Add Chart Element.
Then choose from the different error types available.
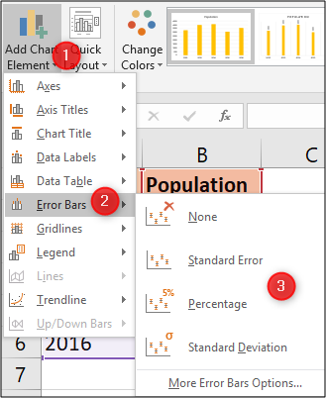
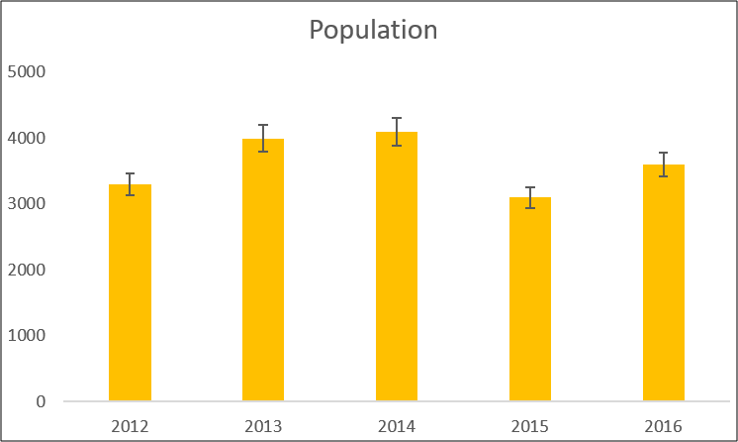
You can show a standard error or standard deviation amount for all values as we calculated earlier in this article. You can also display a percentage error change. The default is 5%.
For this example, we chose to show the percentage.
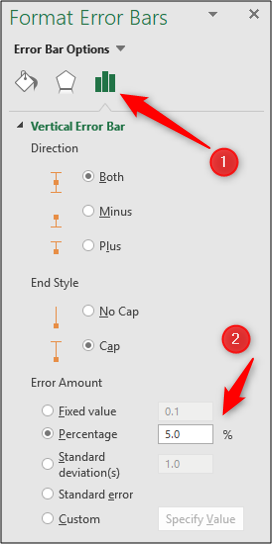
There are some further options to explore to customize your error bars.
Double-click an error bar in the chart to open the Format Error Bars pane. Select the “Error Bars Options” category if it is not already selected.
You can then adjust the percentage, standard deviation value, or even select a custom value from a cell that may have been produced by a statistical formula.
Excel is an ideal tool for statistical analysis and reporting. It provides many ways to calculate uncertainty so that you get what you need.
Also read:
- [New] 2024 Approved Mr. Beast’s Financial Portrait
- [New] Enhancing Visual Presentation Before & After Team Calls
- [SOLVED] Steam Is Having Trouble Connecting to the Steam Servers
- [Updated] A Compreayer's Guide to Growth Updating YouTube Metadata
- [Updated] In 2024, Hottest YouTube Music Playback Responses '23
- [Updated] In 2024, Top 10 FB Video Grabber Add-Ons - Perfect for FireFox Users
- [Updated] Premier Computing Choices The Finest Selection
- Diablo II: Resurrected - Fixes for the Game That Won't Start
- Guide to Resolving Misinstallation Problems with AMD's Ryzen Software Tools
- In 2024, Expert Guide to Crafting Immersive Experiences Through Instagram Vids
- In 2024, Top 4 SIM Location Trackers To Easily Find Your Lost Xiaomi Redmi K70E Device
- In 2024, Universal Unlock Pattern for Google Pixel 7a
- League of Legends Launch Issues: Top Troubleshooting Strategies
- Top Strategies to Prevent Unexpected Closes in Your Frostpunk Gameplay Experience
- Title: Accurately Estimating Data Variability with Microsoft Excel: Techniques & Tips
- Author: Daniel
- Created at : 2024-12-04 18:04:46
- Updated at : 2024-12-06 18:05:07
- Link: https://win-answers.techidaily.com/accurately-estimating-data-variability-with-microsoft-excel-techniques-and-tips/
- License: This work is licensed under CC BY-NC-SA 4.0.